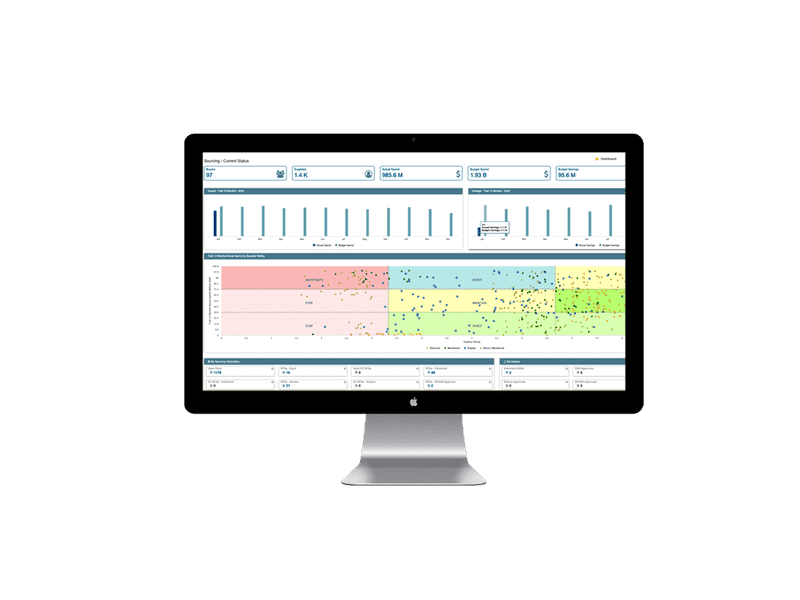
MeRLIN - The Best Spend Analytics Solution

Enhance Spend Visibility and Budget Control with The Best Spend Management Software

How to gain control over your Spends with MeRLIN's Procurement and Spend Analytics Solution?

MeRLIN’ s Spend Management Solution gives a holistic view of your spend and helps in evaluation of spend patterns across the organization to identify areas of improvement and maximize savings.

Improved Visibility

Get a unified view of your spending patterns across categories, regions, suppliers and more

Minimize Maverick Spends

Track internal buying practices to ensure buyers work with preferred suppliers and stay within authorized spending limits. Manage budgets and requisition approvals using workflows

Identify Savings Opportunities

Identify areas of spend leakage and savings opportunities to maximize savings using drilldown reports and spend analytics

image

Industry Leading Procurement Spend Analytics Solution

Decrease procurement costs and improve efficiency by reviewing your procurement spends intelligently. MeRLIN automates collecting, cleansing, grouping, categorizing and analyzing organizational spend and presents simple visualizations that reveal meaningful insights to make smart decisions. 

MeRLIN Logo

Spend Analysis Software features for Procurement

Uncover New Savings with In-depth Spend Analysis

Real-time Spend Analysis

Monitor real-time spend patterns across regions, category, suppliers, etc.

Review Payment Terms

Analyze payment terms and existing contracts to improve contract negotiations with existing and new suppliers.

Standard Dashboards and Reports

Intuitive ready-to-use dashboards and spend reports by category, supplier, payment terms, etc. 

Budget Tracking

Track budget vs spend trends across projects or sourcing programs.

Spend Categorization

Categorize and normalize business spend data using integrated AI and fuzzy logic search capabilities.

Custom Reports and Dashboards

Create custom dashboards and reports to analyze the metrics that is more relevant to you.

Blogs

Frequently Asked Questions

Why do you need spend analysis and how it is used in procurement?

The activity of monitoring and analyzing the organizational spend is called Spend Analysis. The process of spend analysis gives deeper insights into spend patterns in the company and helps in reducing costs, boosting efficiency and managing supplier relationships by increasing visibility and transparency. Using real-time data and analytics procurement teams can dig into spend patterns and gain insights needed to reduce maverick spends, identify savings opportunities and mitigate risks. Spend analysis also enables procurement to consolidate suppliers and spend more with the better ones, benchmark performances, improve contract compliance, develop a better approach to supplier management and make better sourcing decisions with a clear view of how much you are spending, on what you are spending and with whom you are spending.

What is maverick spend in procurement and how do I reduce it?

Purchases done outside of agreed-upon contracts are referred to as “maverick spend.” These purchases may not have been made on purpose, and some may have been made due to real errors or a lack of understanding. Such purchases that deviate from established procurement processes within the organization result in the company not being able to benefit from its preferred supplier agreements offering better product quality, higher discounts, etc., and can become expensive to firms in the long run. 

There are several ways to control maverick spend: 

  • An understanding of the costs associated with maverick spending in a firm, as well as the areas where such spending is prevalent, can help in controlling the situation. A spend analysis solution with automation of approval workflows and auditability can give increased visibility and help organizations trace back to spend details and take precautionary measures to eliminate maverick spend. 
  • Procurement specialists should educate employees on the procurement best practices and train them to follow established procedures. Such trainings will help in reengineering the entire purchasing behavior of the company.
  • Adopt robust sourcing and procurement solutions that can manage both direct and indirect spend from a single platform and integrate easily with your ERP.
  • Not only procurement professionals, but every individual working in the firm should also be aware of the expenditure associated with their area. Knowing the shared accountability helps in controlling maverick spend.

How do you do spend analysis?

 Different organizations might use different ways for spend analysis based on their own demands and variables. The most common approach to perform spend analysis is as follows:

  1. Procurement teams must first identify the source of spend.
  2. Acquire and consolidate the relevant data.
  3. Eliminate errors by cleaning the gathered data. 
  4. Perform grouping or segmentation of suppliers.
  5. Categorize and analyze the spend data.
  6. Study Purchase Price Variance (PPV) across suppliers and regions 
  7. Look at cost as well, if you have the required data 
  8. Analyze variables that impact spend such as logistics, payment terms, where and when you buy, volume discounts etc.
  9. Repeat the above process whenever spend analysis is being performed. Ideally, this should be a periodic exercise that feeds your overall procurement strategy.

How to reduce costs with procurement spend analysis?

Spend analysis is one of the most important cost-cutting methods used by procurement teams. It can help organizations in identifying the areas in which the company overspends, or in which cost or spend can be reduced. A spend analysis can identify things such as maverick spending, contracts not being fulfilled, turnaround times not meeting expectations, overpayments, compliance issues, costs incurred from late fees or penalties, and so much more. 

Procurement teams can use a variety of methods to analyze data and identify areas of opportunity for reducing costs. For instance, doing a should-cost analysis can help procurement understand detailed cost drivers, give a clear view on expected price points and guide future supplier negotiation strategies and broader operations improvement opportunities. 

Procurement teams can use the data from spend analysis to formulate strategies such as identifying more cost-efficient suppliers, consolidating orders and suppliers, negotiating volume discounts, eliminating duplicate orders, controlling overbuying by enforcing controlled procurement practices, etc.

What are the different spend analysis reports generated using spend management software?

Spend management solutions offer many standard spend analysis reports that can help organizations identify saving opportunities and provide visibility to their spend patterns. Many solutions also allow you to create custom reports as per your business needs. 

Some of the most commonly used reports available in MeRLIN are Spend by Buyer, Spend by Supplier, Spend by Category, Spend by Region, Spend by Month, Spend by Payment Term, etc. These reports give insights on what is your spending pattern, how consolidated or fragmented your spend is, how your various business units/departments are spending, how many vendors you have in a category, where can you consolidate spend and leverage volume discounts, what could be the impact of changing payments terms with your high spend suppliers, and so on. This helps you streamline your purchase price variance analysis and make your supplier negotiations much more effective and based on hard facts as well as historical trends.

What is spend cube analysis & how can you do spend cube analysis with MeRLIN?

The spend cube represents various dimensions representing the spend data that is required to be analyzed. The dimensions usually include Categories/sub-categories, buyers, spend with suppliers, etc. 

MeRLIN allows you to browse cubes from the buyer portal enabling users to interact with the data warehouse generated by MeRLIN in a user-friendly way and to view customized data in tabular format and download them into Excel. The table generated can also be viewed as a bar chart or line chart to analyze the data easily. You can then slice and dice the data in multiple ways to gain more insights. To do spend cube analysis with MeRLIN

  1. Go to Analytics 🡪 Browse Cubes
  2. Choose the cube that you wish to browse. 
  3. Select one or more measures from 
  4. Select one or more dimensions from columns and/or rows
  5. Click on “Generate” to view data
  6. Click on “Export” to export the viewed data into Excel format

Factsheet

Uncover meaningful insights from your sourcing data and trends that translates to new opportunities for savings and growth.